Your bundled code deserves some attention too!
At 4/19/2024
Development toolchains now have many more layers of tools than they did years ago. Because of this change, the JS code that runs in our users’ browsers looks less like the original code we authored. Periodically checking the code generated by our tools can lead to opportunities to reduce bundle size and improve performance for users.
Looking at the code as-is in production
This first step involves opening up devtools on your production site, opening the network tab, and looking at each JS file that is loaded. This is an opportunity to see if any unexpected files are being loaded, and to find out if and how code splitting is being applied to your bundle.
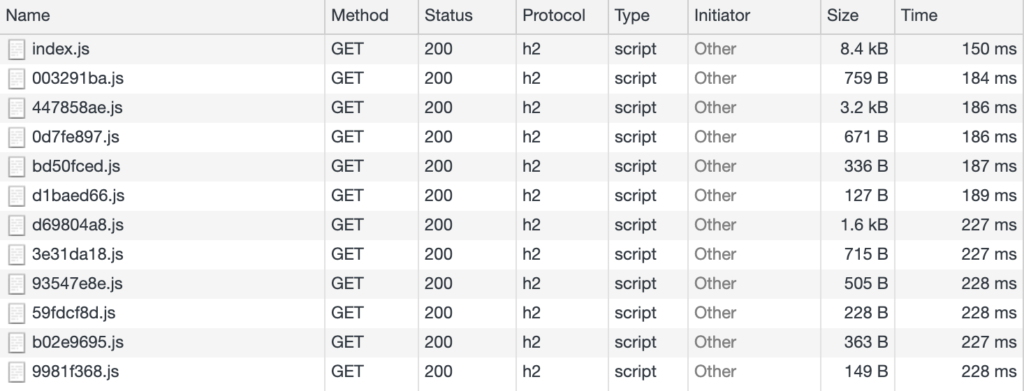
In this example, I’m looking at the code loaded for Peregrine. We can see that code splitting is being applied, and that the bundle is split up into a bunch of smaller scripts that depend on each other. This means that most of the time, only JS necessary for the current route gets loaded.

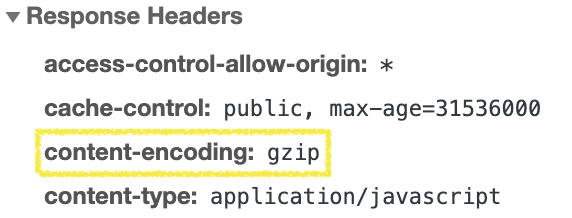
This is also an opportunity to make sure that all JS is minified and compressed. Minification works by removing whitespace, shortening variable names, and replacing code with smaller syntax that is functionally equivalent. You can check that your code is being minified by right-clicking the JS requests in the network panel, opening them in a new tab, and verifying that the whitespace is removed and that all the variable names are shortened into 1 or 2 letter names. Check that the content-encoding response header is set to gzip or br to make sure the content is compressed. Compression will help reduce the network transfer size of the JS file by taking advantage of repeated patterns in your code.

Finding third-party dependencies in your code
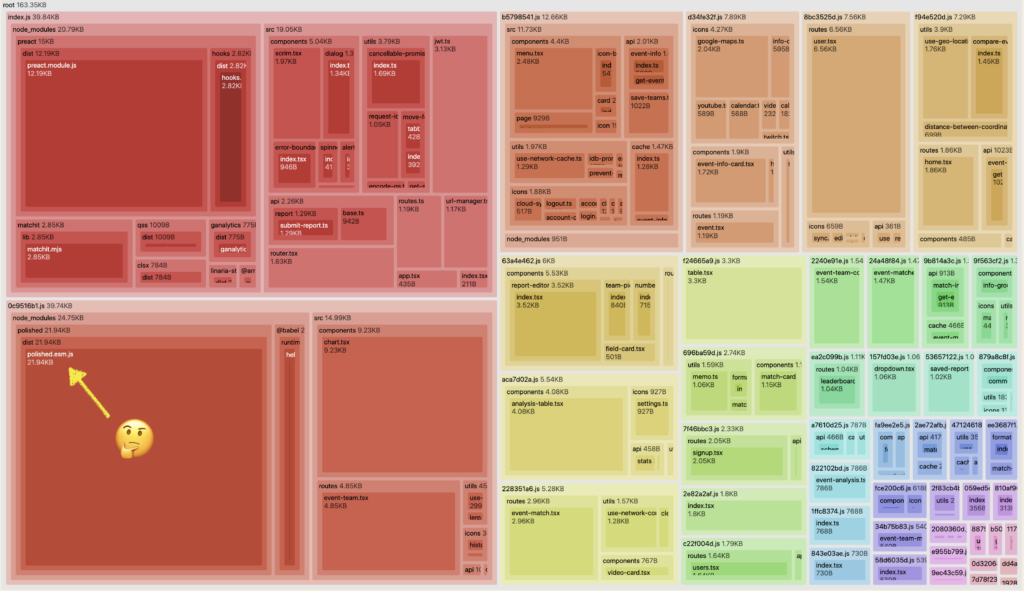
A tool like webpack-bundle-analyzer can help you find dependencies that are taking up too much space in your bundle (similar tools exist for other bundlers). Webpack-bundle-analyzer will show how much space each file/dependency is taking up in your bundle, as well as how the files are distributed across chunks. Discovering just how much space dependencies take up in our bundles can be really eye-opening; we don’t often understand or think about the bundle size cost that is incurred each time we import a new dependency.

We can see the output chunks, each showing the source files that were included. In this example, we can see which pieces of code are taking up the most space, especially the ones being loaded by the index.js chunk which is loaded on every page. We can also see that polished.esm.js is taking up a fair amount of space, and that there is a good opportunity to move that script to be only loaded during the build process.
When we discover dependencies that are taking too much space, one of the most impactful options is finding replacement dependencies that only fill the needs that you have. For example, if you are using Apollo for GraphQL, you should consider whether a smaller alternative without all the bells and whistles will do the trick, like urql or grafoo. Pika’s package search and bundlephobia can help you find and compare packages’ bundle size.
Reading through the generated code
Another step in understanding the code in a bundle is to temporarily disable a few of the optimization steps, open it up, and read parts of it.
This step involves running a production build with name mangling disabled. Mangling is the process of shortening variable and function names to reduce the output size. By disabling mangling, it will be easier to see where different pieces of code come from. Be sure to keep minification enabled, because you still want the minifier to perform other optimizations apart from mangling, like dead code elimination and code simplification.
In Terser (the minifier that Webpack uses by default), variable/function name shortening can be disabled by passing mangle: false. Webpack allows you to specify options to Terser via terser-webpack-plugin
After disabling mangling, run a production build, and then run Prettier on the minified files. This will add back whitespace, which will make the code much easier to read. Then pop open your editor and take a look at some of the bundled files.
As you scroll through the files, try to identify where each piece of code comes from. Is there code that you recognize as your app code? Can you identify code coming from dependencies? What about code generated by your bundler and tools like TypeScript and Babel? How is the compiled code different from the original authored code?
Here’s a snippet of bundled code from Peregrine:
events
  ? v(
      p,
      null,
      v(
        UnstyledList,
        { class: 'm1imsjt6' },
        events
          .filter((event) => {
            var _event$district, _event$fullDistrict
            return (
              !query ||
              event.name.toLowerCase().includes(lowerCaseQuery) ||
              event.key.toLowerCase().includes(lowerCaseQuery) ||
              event.locationName.toLowerCase().includes(lowerCaseQuery) ||
              (null == (_event$district = event.district)
                ? void 0
                : _event$district.toLowerCase().includes(lowerCaseQuery)) ||
              (null == (_event$fullDistrict = event.fullDistrict)
                ? void 0
                : _event$fullDistrict
                    .toLowerCase()
                    .includes(lowerCaseQuery))
            )
          })
Code language: JavaScript (javascript)
With a little bit of digging, we can find the source code that produced that snippet.
<UnstyledList class={matchListStyle}>
  {events
    .filter((event) => {
      if (!query) return true
      return (
        event.name.toLowerCase().includes(lowerCaseQuery) ||
        event.key.toLowerCase().includes(lowerCaseQuery) ||
        event.locationName.toLowerCase().includes(lowerCaseQuery) ||
        event.district?.toLowerCase().includes(lowerCaseQuery) ||
        event.fullDistrict?.toLowerCase().includes(lowerCaseQuery)
      )
    })
Code language: JavaScript (javascript)
At this point we can answer some important questions about our bundled code:
– Is there code that is transpiled to an older/larger syntax than is necessary?
– Is there any unnecessary polyfill or helper code being injected by Babel or other tools?
Notice how the JSX became transpiled into v function calls, how the class name variable got replaced with a static string, and how the optional chaining caused a couple of new variables to be created. Even though there’s nothing alarming about the differences between the source code and the transpiled code in this specific case, it is still useful to ask ourselves questions like “How exactly does optional chaining get transpiled?,” “What does JSX look like after compilation?” and “I wonder if Terser inlined that variable.” By learning the answers to these questions, we can adjust the way we write our source code and set up our tooling to reach a balance between code that is understandable for developers and code that our tools will keep small.
Conclusion
The emergence of more and more tools in the frontend JS ecosystem is both a blessing and a curse. Tools allow us to use modern JS features without limiting our users’ access to our websites. They allow us to ship smaller and faster code, and they allow us to abstract and separate our source code without our users paying the performance cost. But these same tools make it so that the code that reaches our users is very different from the original code we authored. We’ve distanced ourselves from the code that runs in our users’ browsers. By breaking this pattern and understanding our tools, we can observe and fix tooling problems to deliver faster and more equitable experiences.
