New Chrome Developer Tool Illuminates Opaque Responses
At 4/19/2024
Chrome is introducing an opaque response-type visual indicator hoping to shed some light on exceeded storage quota errors when caching opaque responses.
As described in this Chromium ticket, the goal of the indicator is to reduce developer confusion over large chunks of storage quota consumed for mysterious reasons, as I had encountered in When 7 KB Equals 7 MB.
After reading through the ticket, I decided to try it out in Chrome Canary 72 using their example:
const cache = await caches.open('test-cache') const request = new Request('https://www.google.com/images/branding/product/ico/googleg_lodp.ico', {mode: 'no-cors'}); const response = await fetch(request); cache.put(request, response);Add an opaque response to the Cache Storage API. The following is sufficient if you run it in the console of an arbitrary page served on a secure origin:
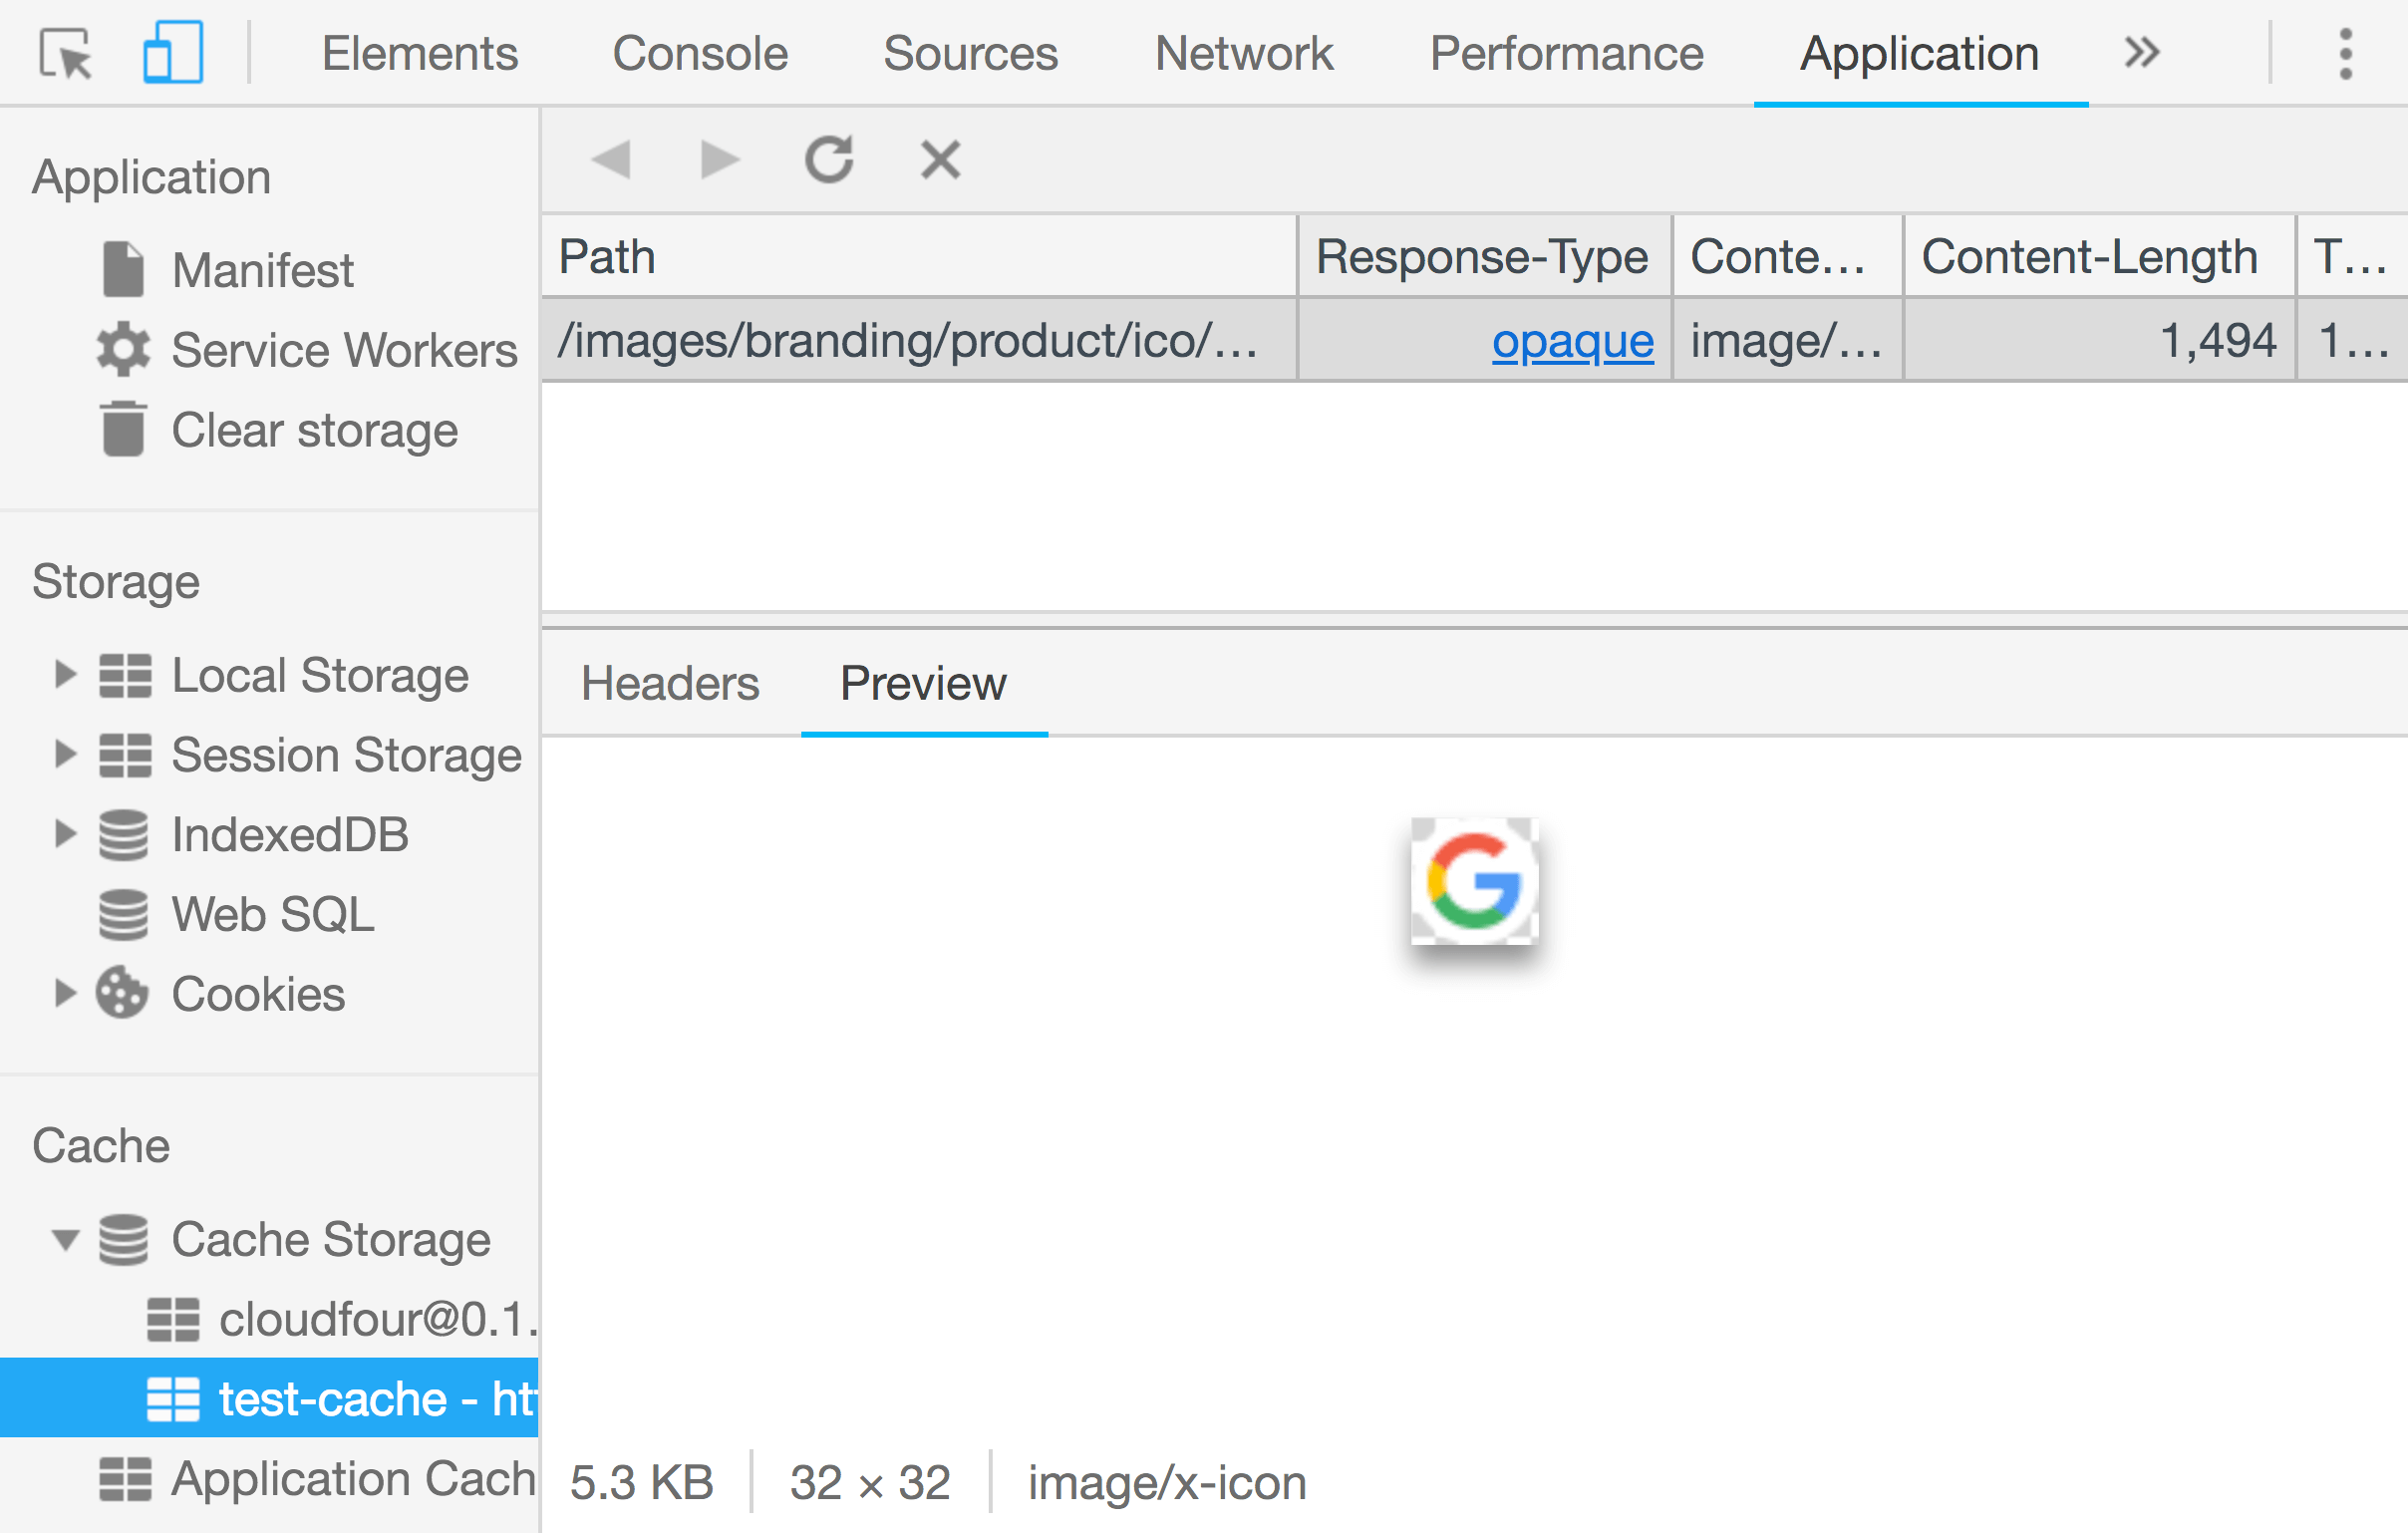
I then opened the Chrome DevTools “Application” tab and found my way to the test-cache that was created:

Of note is a new “Response-Type” column. You’ll notice the image that was added to the test-cache reads “opaque.” Very nice! If you hover over the link, there is a helpful tooltip that reads:
As a security consideration, an opaque response potentially takes up far more cache space than its content length
The “opaque” link helpfully takes you to the Google Developers Debug Progressive Web Apps page reminding why caching opaque responses can easily exceed storage quota limitations.
While a small detail, this new visual indicator is a great idea and hopefully helps the community to avoid the terrifying and UX impacting DOMException: Quota exceeded error.
